
This article covers the “Analyze resource utilization and consumption” section of the AZ-100 and AZ-103 Exams and is part of my AZ-100 Study Notes series.
Configure diagnostic settings on resources
Diagnostic Settings is located on Virtual Machines and can be found under the Monitoring section of the navigation
You must enable Diagnostics on a machine by going to ‘Diagnostics settings’ and then selecting a storage account to store data and then clicking ‘Enable guest-level monitoring’. It is not enabled by default.
Metrics may be configured by selecting ‘Configure metrics’ on the Diagnostics settings page. By default, the Processor, Memory, Network, File System and Disk metrics are recorded although custom metrics may be set up also.
Syslog data for all logs are also collected by default, along with boot diagnostics.
More information can be found here – https://docs.microsoft.com/en-us/azure/azure-monitor/platform/diagnostic-logs-overview
Create baseline for resources
A baseline for a specific resource may be acquired via the ‘Metrics’ page available from the individual resources.
To analyze Metrics, first select the resource to view (defaults to the current resource, then choose a specific Metric to view such as ‘Percentage CPU’ and then the type of aggregation such as ‘Avg’. This will then display a graph over the past 24 hours by default showing the Metric chosen.
Multiple Metrics can be added by clicking ‘Add metric’.
From here you can also pin various queries to the dashboard and change the type of chart.
Create and test alerts
Alerts can be configured by doing the following –
- Go to the ‘Alerts’ page found in the ‘Monitoring’ section of a resources menu.
- click ‘New alert rule’
- Select a resource to create an alert for (defaults to the current resource)
- Click ‘Add condition’ and select a Metric to report on. Eg ‘Percentage CPU’
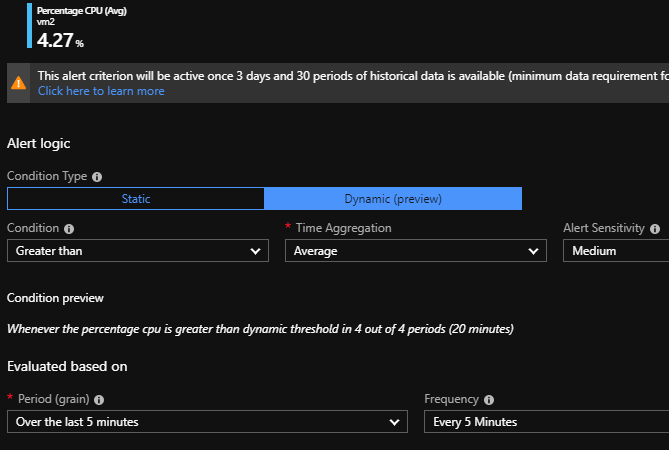
- Select either a ‘static’ condition Type which would be for example ‘Greater than Average 90 (%)’ or a ‘Dynamic’ condition type which uses Microsoft machine learning algorithms to decide on whether to trigger an alert. An example of dynamic would be ‘Greater than Average High/Medium/Low’.
- If picking ‘dynamic’ you then configure how it evaluates the data by configuring the Period to analyse and the frequency with which to do so.
- Once the condition is created you then either select an existing or create a new ‘Action Group’ which is basically the process to follow whenever an alert threshold is reached. This can be an email to IT or a text message or various other things such as runbooks, functions, logic apps etc.
- Once that’s configured you then specify a name for the new alert such as ‘Percentage CPU greater than dynamic’, provide a description of the alert and finally specify the severity
There doesn’t appear to be a built-in method to test an alert as evidenced by this request on the Azure feedback site – https://feedback.azure.com/forums/231545-diagnostics-and-monitoring/suggestions/33963055-test-alert-notifications
Analyze alerts across subscription
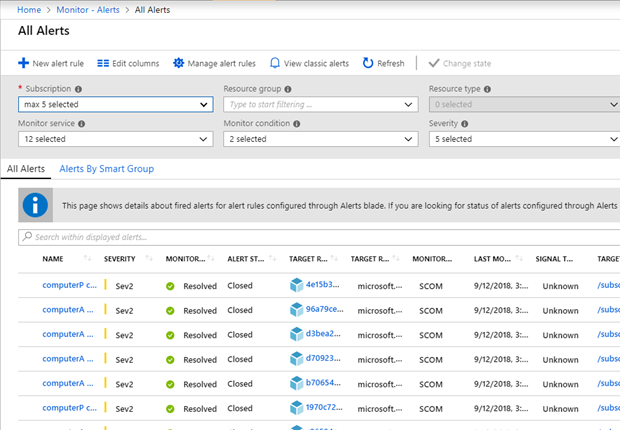
All alerts within a resource group may be seen as an overview by going to the resource group and selecting ‘Alerts’ in the ‘Monitoring’ tab which will bring up all fired alerts.
All alerts within a directory/tenant may be found by going to ‘Monitoring’ and then selecting ‘Alerts’ which gives an overview of every resource. All alerts can also be configured from this location by clicking ‘Manage alert rules’.
More information can be found here – https://docs.microsoft.com/en-us/azure/azure-monitor/platform/alerts-overview
Analyze metrics across subscription
Metrics may be analyzed via the ‘Monitor’ feature following roughly the same process as analyzing alerts. This also uses the same interface as viewing metrics from an individual resource.
Create action groups
An action group is a collection of notification preferences used primarily by the alerts functionality in Azure. Eg. Email sysadmin or text the on-call rota.
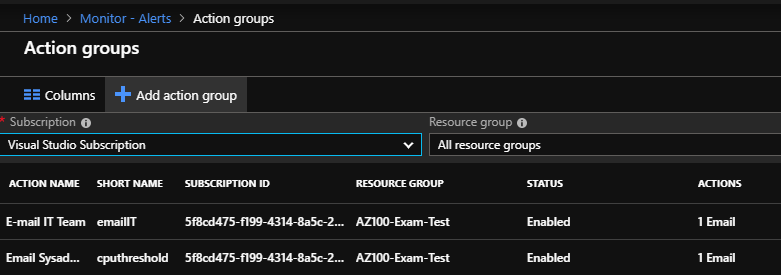
Action groups may be created directly from the Alert creation/configuration screens or may also be created via the ‘Monitoring’ section in the ‘Alerts’ page by selecting ‘Manage action groups’.
The ‘Manage action groups’ page provides an overview of all created action groups including whether they are currently enabled.
Action groups may be setup using the following process –
- Select ‘New Action Group’ when creating an alert or go to Monitor > Alerts > Manage action groups > Add action group
- On the ‘Add action group’ page provide a ‘Action group name’ and a ‘Short name’ which is used in notifications to identify the action group.
- Select the Subscription to assign it to and finally a Resource Group that the group will be associated with.
- In the Actions section, we then define the action to carry out when the group is called by an alert.
- Provide an ‘Action Name’ then select the type of action to perform from the Action Type drop-down.
- Once you’ve selected a type of alert a contextual window will open up with the fields varying depending on the type of alert. The example below shows a configured alert that generates an email and a text to a specific number.

More information on this can be found at – https://docs.microsoft.com/en-us/azure/azure-monitor/platform/action-groups
Monitor spend
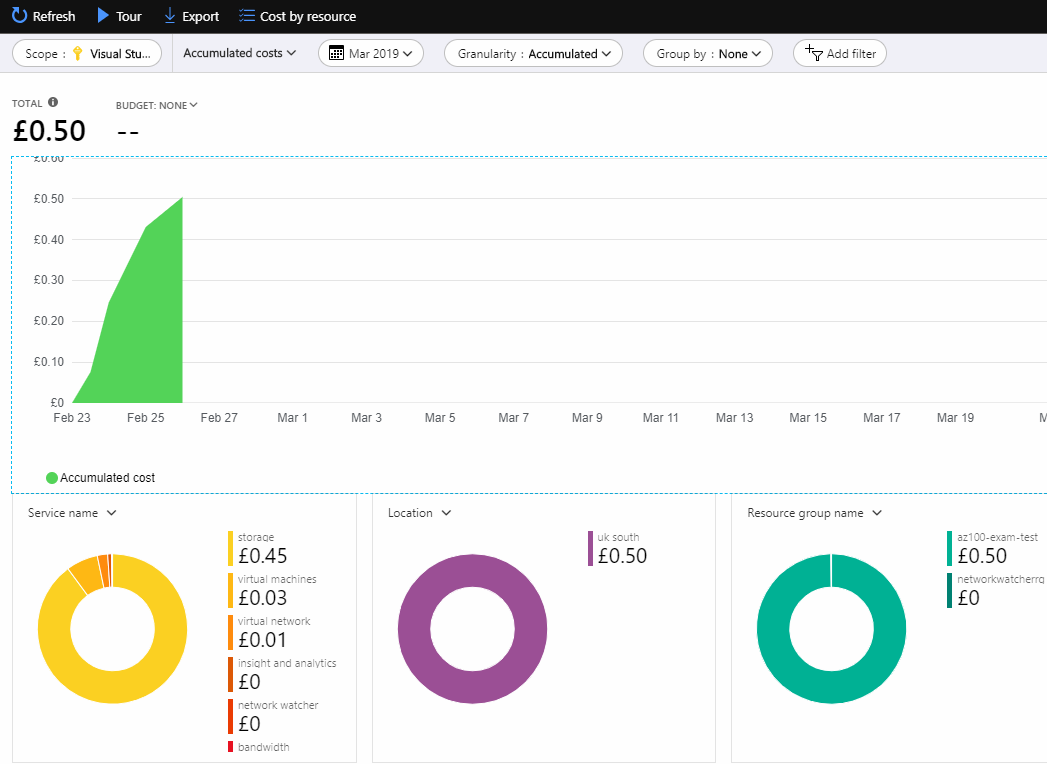
Costs associated with subscriptions may be found by going to the relevant Subscription then selecting ‘Cost analysis’ in the menu below the ‘Cost Management’ heading.
From here the cost is broken down visually by total accumulated cost, and a breakdown by Service Name, Location and Resource group name by default, although it is possible to change various filters in order to acquire different views of the associated costs.
Automated alerts can also be configured based on various cost factors by going to a Subscription and selecting ‘Budgets’ under the ‘Cost Management’ heading. This allows for creating various alerts linked to Action Groups.
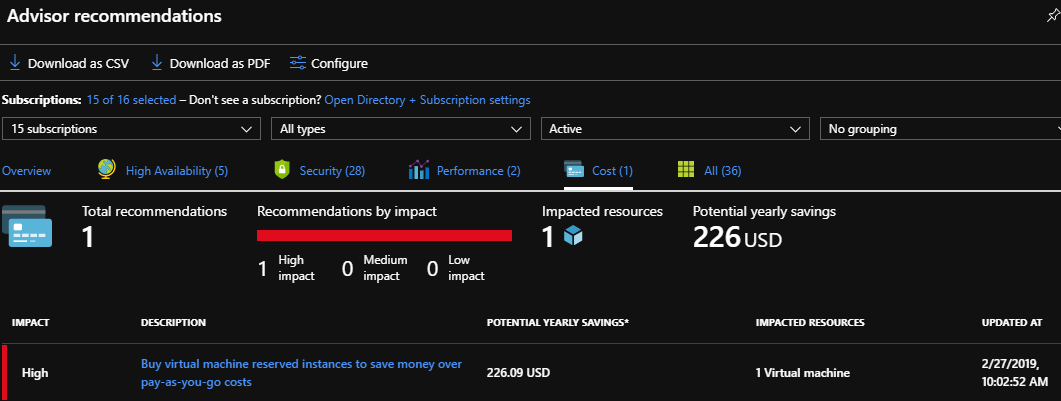
Recommendations on changes to various services which will reduce costs can be found by navigating to Advisor and then selecting the ‘Cost’ option. This will suggest various options such as purchasing reserved virtual machine instances and will provide a projected cost saving.

Further information on this can be found at – https://docs.microsoft.com/en-us/azure/billing/billing-getting-started
Report on spend
Current Cost data may be exported from the ‘Cost analysis’ page described above and can be directly reported in the form of alerts using the Automated alerts described above.
Detailed cost information can be viewed by navigating to ‘Cost Management + Billing’ then selecting the Billing account to review which will then provide a list of all subscriptions. From here you can then select a subscription to bring up a report on its current costs per resource and a forecast of costs.

This can then be further broken down by selecting ‘Cost analysis’ which can then be exported as required.
Tagging resources is fairly important to get good data, the example provided by Microsoft is ‘costCenter : marketing’ which if this was done consistently across resources and subscriptions would allow for granular reports based on individual costs.
Utilize Log Search query functions
Analytics Setup
Log Analytics must be set up, with the easiest method being to click ‘Create a resource’ at the top-left of Azure and doing a search for ‘Log Analytics’. Select the result and then click ‘Create’.
At this point, you must provide a ‘Log Analytics Workspace’ name which seems to require being unique. I’m unsure if this is unique within a region or globally but it does seem to verify against workspaces outside of my own Azure instance. You then either create a new Resource group or link it to an existing one and finally select a location.
Although there is a Pricing tier field, it appears to be historical as all workspaces now charge per GB used.
Workspace Data Sources
Once the Log Analytics is created it is basically just an empty data store, we then need to configure the Data Sources to start populating it.
The available Data sources are Virtual machines, Storage account logs, Azure Activity logs, Scope Configurations and Azure Resources of various types. These may be automatically configured via policies applied to resources or manually set in the relevant page under the ‘Workspace Data Sources’ heading within the Log Analytics resource
The specific data to retrieve from defined data sources is configured via the ‘Advanced Settings’ page in the Log Analytics Workspace. This is done by selecting Data > Data Type (Eg. Windows Event Logs) and then selecting the various events to retrieve.
This page allows you to configure connected resources further and also allows for downloading agents which are used to connect physical devices such as Windows servers so that event logs can be gathered from Azure and on-premise.

Log Search Queries
Logs may be queried through a variety of methods with the primary ways being by selecting ‘Logs’ under the ‘General’ heading in the workspace and defining queries or by selecting ‘Saved searches’ which provides several predefined templates of queries.
Worth going through some of the predefined queries to see the structure of the query language.
An example of a simple query which returns the total Memory utilization of 2 connected windows machines in 10m increments as a time chart is displayed below –

More information may be found at – https://docs.microsoft.com/en-us/azure/azure-monitor/log-query/get-started-portal
View alerts in Log Analytics
Alerts are fairly straightforward and covered in enough detail higher up.
Alerts can be displayed by accessing the ‘Alerts’ menu item within the Log Analytics workspace. When going via this method it will default the filters to only query the current Log workspace.
Alerts within a Log Workspace are arguably better in some cases that the standard Alerts based on Metrics as they enable you to utilise saved queries covering complex situations and querying multiple resources at the same time thanks to the centralisation of logs.
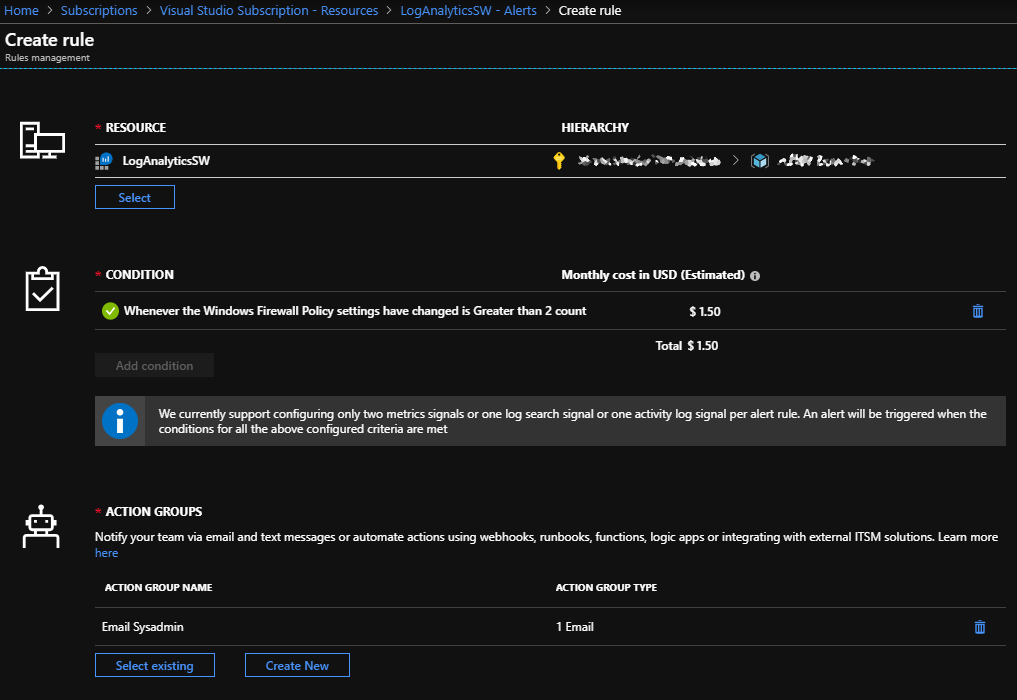
A good (if impractical) example of this would be setting up an alert triggered by a Windows Firewall Policy change on more than one machine within a 5-minute window (via Event Logs) of all machines connected to a specific subscription which may indicate a change being made to group policies which you may want to then analyse further.
More information can be found at – https://docs.microsoft.com/en-us/azure/azure-monitor/log-query/functions


Leave a comment